almost a fifth of UK drivers (19%) have had a car stolen, and more than a third (34%) have had one broken into in the past.
AA Insurance reveal
a troubling 25 percent rise in car thefts in the UK
Possessions stolen from cars
In 2022, thieves made off with a staggering 212,900 items
Top 5 worst UK cities for a car being stolen
When it comes to the most dangerous cities for car thefts and break-ins, Leeds tops the list for both crimes. In fact, the research suggests that 27% of Leeds-based drivers have previously had a car stolen, and 44% have had one broken into. (source: compare the market.com)
1. Leeds (27%)
2. Newcastle (24%)
3. Manchester (22%)
4. London (22%)
7. Halifax (12.80)
around 74,769 vehicles were stolen in 2020
That's about 205 cars per day
72% of stolen vehicles
are not returned to their owners
Top 8 worst cities for a car broken into
When it comes to the most dangerous cities for car thefts and break-ins, Leeds tops the list for both crimes. In fact, the research suggests that 27% of Leeds-based drivers have previously had a car stolen, and 44% have had one broken into. (source: compare the market.com)
1. Leeds (44%)
2. London (39%)
3. Liverpool (38%)
4. Newcastle (36%)
5. Birmingham (36%)
6. Nottingham (36%)
7. Manchester (35%)
8. Sheffield (35)
9. uk average (34%)
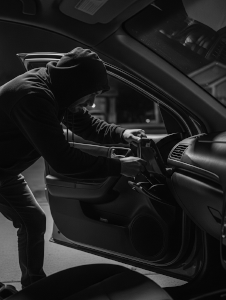
keyless entry
36% of vehicle thefts are by keyless entry
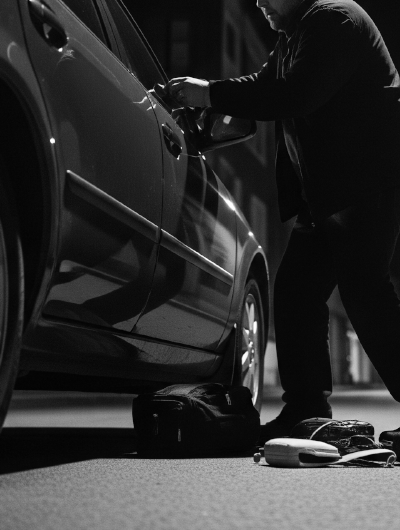
evening or overnight
80% of vehicle thefts happen in the evening or overnight